


Blog > Cx excellence
BFCM customer support benchmarks: what ticket volume actually looks like
Every support leader wants one number before the holiday peak season: how much bigger will the BFCM support queue get? No universal figure exists because ticket volume can vary based on your usual order count, your contact rate, and how well your shipping promises hold up.
Below, we’ve compiled some 2025 and 2026 benchmarks you can use to build a forecast for this year’s upcoming BFCM 2026, which runs Friday, November 27 through Cyber Monday, November 30.
And in case you missed it: here’s our 2026 BFCM planning guide, available for free to help you know what to expect and how to prepare.
Historical BFCM spending trends
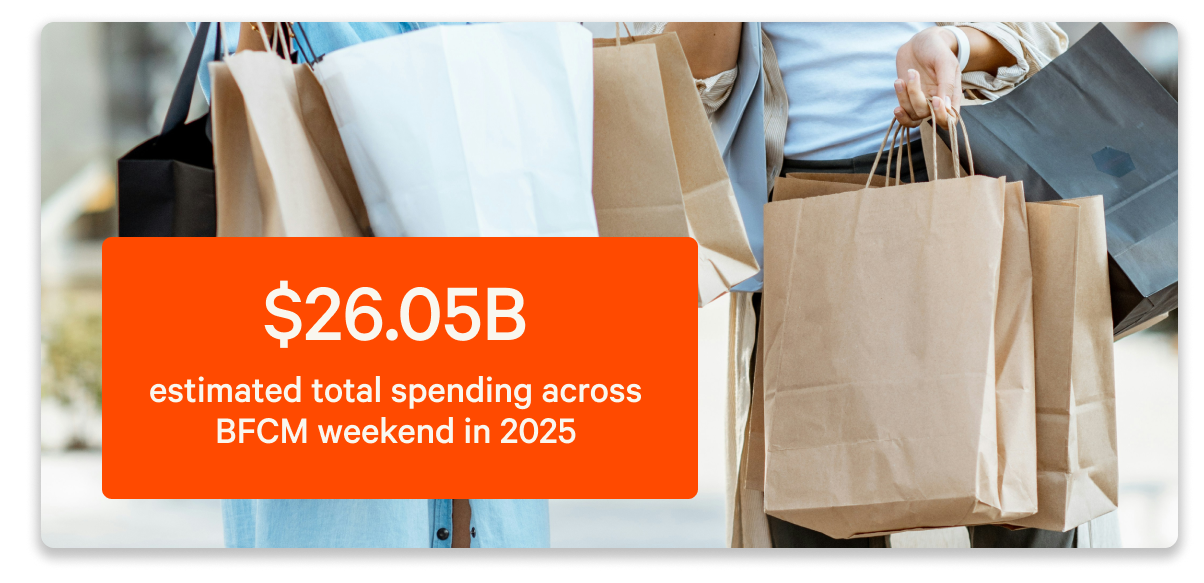
Adobe measured $44.2 billion in U.S. online spending across Cyber Week 2025, up 7.7% year over year. Black Friday reached $11.8 billion and Cyber Monday hit a record $14.25 billion.
Globally, Salesforce tracked $336.6 billion in sales, but order volume grew just 2% while average selling price rose 6%. Growth is coming from bigger baskets more than more orders, so expect higher-stakes tickets rather than a pure volume explosion.
The window is also stretching. Infobip's September 2026 survey found only 19% of shoppers wait until BFCM week to start holiday shopping, and nearly six in ten will have started by early November. This means brands need to think about staffing for BFCM as a wide window and not just a single weekend.
What BFCM ticket volume actually looks like
The most useful BFCM-specific data comes from Gorgias merchants. Their findings show that between November 20 and December 2, 2025, pre-purchase conversations ran about 51% heavier per day than the September and October baseline. Questions about brand policy, such as discount terms and warranty coverage, grew about 73% per day.
On the support side, Cornbread Hemp reported that its tickets doubled during BFCM 2025. That is one brand, not an industry benchmark, but it shows how quickly a lean team gets outrun.
You will also see claims online that BFCM volume jumps three to five times. Few trace back to primary data. Build your own forecast instead: projected orders multiplied by your contact rate (tickets divided by orders). Then divide by capacity.
Many brands treat 40 to 60 tickets per agent per day as a healthy benchmark. As a hypothetical, 20,000 orders at a 5% contact rate is 1,000 tickets, or about 20 agent-days at 50 tickets each. Pad that number for the questions you cannot predict.
Order status is the usual culprit. DigitalGenius estimates, as reported by ReadyCloud, put "where is my order" contacts at 10% to 25% of volume in normal months and 15% to 40% at peak. That spread is the point. Pull your own WISMO rate before you set targets.
Returns come next. NRF and Happy Returns found retailers expect 17% of holiday sales to be returned. Their 2025 returns report estimates 19.3% of online sales will come back, and 82% of consumers say free returns are an important consideration. What this means: plan your post-BFCM returns queue now.
Response time benchmarks
| Channel | Baseline first response | Best in class |
|---|---|---|
| 12 hours | Under 1 hour | |
| Live chat | 1.5 minutes | Under 1 minute |
| Social media | 5 hours | 1 hour |
Source: Gorgias
Shopper expectations are running ahead of those baselines. Infobip found 47% of consumers expect a support answer within five minutes. Zendesk's 2026 CX Trends found 88% expect faster responses than a year ago and 74% expect 24/7 support.
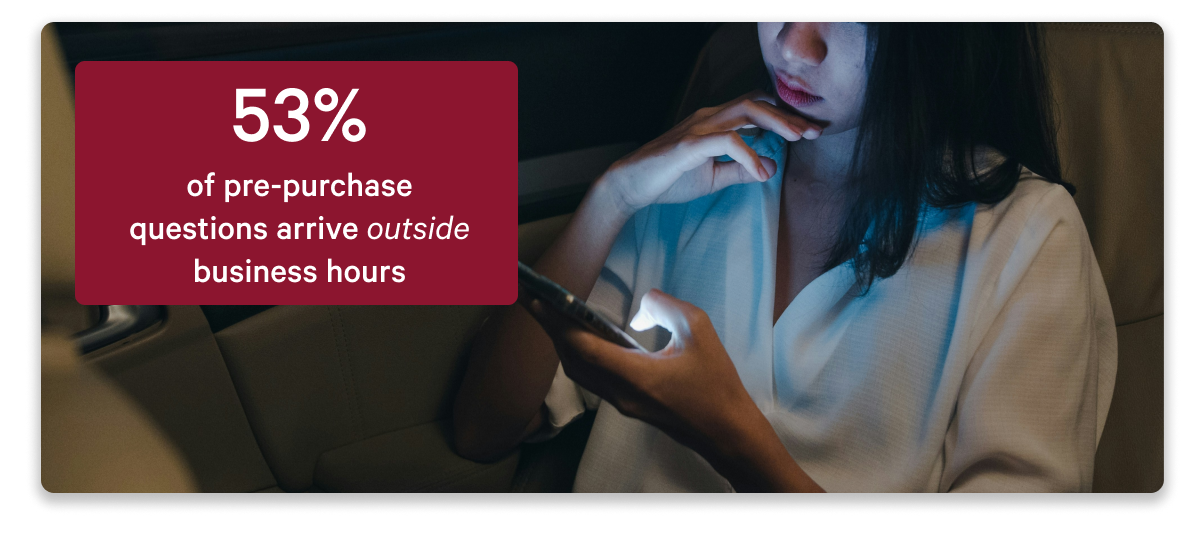
Nights and weekends are where things can slip. Gorgias found that 53% of pre-purchase questions arrive outside business hours. The median human first response stretches from 2.2 hours during the day to about 15 hours after it. CSAT barely moves (86% vs 85%), which is the trap: the shopper who gave up and bought elsewhere never fills out a survey.
AI support benchmarks
Adoption is nearly universal. Gorgias reports 96% AI adoption among eCommerce brands in 2026. Salesforce found AI and agents influenced 20% of global Cyber Week 2025 orders. Agentic customer service conversations grew 55% week over week, and agent actions like address updates and returns rose 70%.
The metric that matters is resolution, not deployment. Gorgias data shows the median brand resolves 45% of AI-touched tickets end to end, while the top quartile clears 65%. The rest are handed to humans, where the median shopper waits about 10 hours and 33% of handed-off tickets never receive a human reply. Cornbread shows the upside: AI handled 400% more tickets than the prior year, first response time fell to 21 seconds, and CSAT held flat.
Keep humans on the hard conversations. Infobip found consumers are more willing to let AI inform decisions than handle complaints, and Zendesk reports 85% of CX leaders say one unresolved issue is enough to lose a customer.
Targets to set before BFCM 2026
- Capacity: 40 to 60 tickets per agent per day
- Speed: chat under 1 minute, email under 1 hour
- Automation: a 45% AI resolution rate is the median, 65% is top quartile
- Coverage: a real plan for the 53% of buying questions that arrive after hours
- Preparation: WISMO and returns macros, and a policy FAQ covering promo terms and warranties, ready before the first promo email goes out
Frequently Asked Questions
How much does customer support ticket volume increase during BFCM?
Pre-purchase conversations run about 51% heavier per day in the 2025 BFCM window than in the fall baseline, but this can be influenced by factors such as industry, consumer trends, and brand popularity. Forecast from your own orders and contact rate.
How many tickets can one agent handle per day during BFCM?
Many brands treat 40 to 60 tickets per agent per day as healthy. Use your own tickets-resolved-per-agent average to set your number.
What is a good first response time for BFCM support?
Best-in-class benchmarks are under one minute for live chat, under one hour for email, and one hour for social media. Up to 47% of consumers expect an answer within five minutes.
What share of BFCM tickets can AI resolve?
The median brand resolves 45% of AI-touched tickets end to end, and top-quartile brands exceed 65%.
When is BFCM 2026?
Black Friday falls on November 27 and Cyber Monday on November 30, 2026.
Get started with Influx
Influx was established in 2013 & has been trusted by 750+ brands globally, ranging from startup to scale.
Influx builds 24/7, near-shore global customer support teams. We provide fully managed, flexible & high-performance agents. Our services range from eCommerce support, tech support, sales support, AI Management, Enterprise solutions and more to give you the customer assistance you need to prioritize other responsibilities and continue scaling your business.
Make your support operations fast, flexible, and ready for anything with experienced, 24/7 support teams working on demand. See how brands work with Influx to deliver exceptional customer support or get a quote now.



Read more client testimonials or case studies
 6 Circle - small.png)